I’m the last one in my family to own a Tesla. This is an odd statement until you understand that I live in coastal California where a Tesla is as a popular as a Honda Accord. Just yesterday, I counted at least 10 Teslas on my 5-mile commute home.
If I used my commuting observations as an indicator for electric vehicle saturations, my forecast would majorly distorted. Whether it’s overstating saturations (like me) or understating saturation (like some of you), our personal experience is biased and needs a healthy injection of unbiased data.
So, how many EVs are in my area?
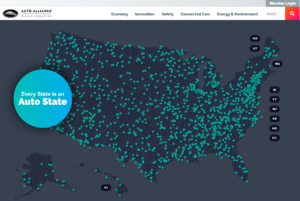
The Auto Allianceis an industry trade group that provides statistics on the auto industry. While you can view data by any state, I drilled into California.
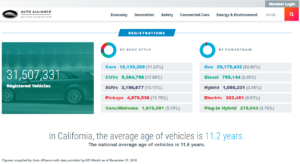
Scrolling down to the bottom of the California data, is a section labelled “Registrations”.
And there it is. In 2018, California had 31.5 million registered vehicles and 16.1 million were cars. There are 262,481 electric vehicles which is 0.83% of all vehicles. If you assume all electric vehicles are cars (not a bad assumption), then the ratio is 262,841 to 16,139,269, or 1.6% of cars.
For many, state-level data are not refined enough. In this case, drill down to the congressional district level and do some math. Once you figure out how districts map your service territory, you can get close to what’s registered in your service territory.
On second thought, my perception of electric vehicle ownership in my family isn’t 75% (1 family out of 4), it’s really 30% (3 vehicles out of 10). That make me feel a bit better. After all, it’s all about getting good data.
Mark Quan est consultant principal en prévisions au sein de la division des prévisions d'Itron. Depuis qu'il a rejoint Itron en 1997, M. Quan s'est spécialisé dans les solutions de prévision énergétique à court et à long terme, ainsi que dans les projets de recherche sur la charge. Quan a développé et mis en œuvre plusieurs systèmes de prévision automatisés pour prédire la demande système du lendemain, les profils de charge et la consommation au détail pour des entreprises aux États-Unis et au Canada. Les solutions de prévision à court terme comprennent des systèmes pour le « Midwest Independent System Operator » (MISO) et le « California Independent System Operator » (CAISO). Les solutions de prévision à long terme comprennent le développement et le soutien des prévisions à long terme (ventes et clients) pour des clients tels que « Dairyland Power » et « Omaha Public Power District ». Ces prévisions comprennent des informations sur l'utilisation finale et les impacts de la gestion de la demande dans un cadre économétrique. Enfin, Quan a participé à la mise en œuvre de systèmes de recherche de charge, notamment chez Snohomish PUD. Avant de rejoindre Itron, Quan a travaillé dans les secteurs du gaz, de l'électricité et de l'entreprise chez Pacific Gas and Electric Company (PG&E), où il a participé à la restructuration du secteur, à la planification de l'électricité et à la planification du gaz naturel. M. Quan est titulaire d'un master en recherche opérationnelle de l'université de Stanford et d'une licence en mathématiques appliquées de l'université de Californie à Los Angeles.