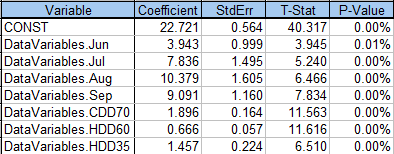
MetrixND provides several options for determining whether a variable is useful. Typically, a model builder reviews the variable coefficients, standard error, t-statistic and p-values. These statistics are located on the “Coef” tab as shown below.
An evaluation of the variable coefficients shows that each variable is significant and behaves as expected. For instance, the CDD70 variable has a t-statistic of 11.563 (statistically significant) and indicates that when cooling degree days (CDD70) increase, sales increase by 1.896 units.
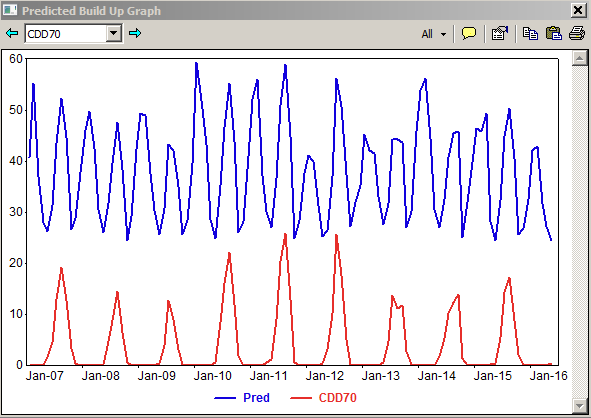
While these numerical results are useful, a graphical depiction of the variable aids the understanding of the variable’s contribution to the model. In the regression model object, the BX tab provides the picture of each explanatory variable’s contribution to the predicted value.
In the figure below, the contribution of CDD70 (red line) is compared to the model’s predicted value (blue line). Formally, the CDD70 line is calculated from the CDD70 variable value and the CDD70 coefficient (BCDD70 x XCDD70).
The power of the graphic is visual clue about what each variable is doing to generate the predicted value. In this example, the CDD70 variable is responsible for the summer cooling shape.
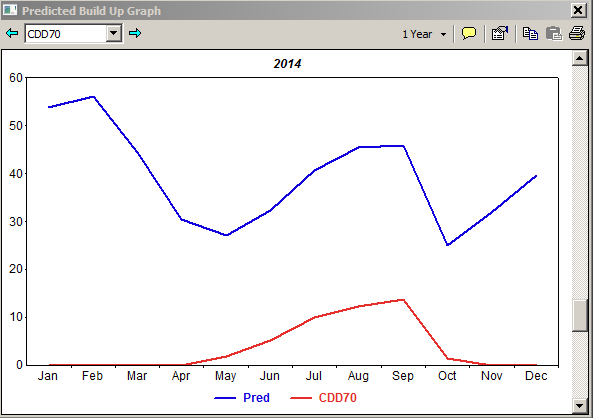
A closer inspection of the graphic (zooming into 2014 in the figure below), shows how CDD70 only contributes to the predicated values in May through October. So while the predicted value decreases from April to May, the graphic tells us the decrease is not caused by the CDD70 variable because CDD70 does not contribute to the April predicted value.
Coupled with the traditional variable statistics, the BX view enhances the model builder’s understanding of variable’s contribution and power. Begin using the BX tab and add it to your box of model building tools.
Mark Quan est consultant principal en prévisions au sein de la division des prévisions d'Itron. Depuis qu'il a rejoint Itron en 1997, M. Quan s'est spécialisé dans les solutions de prévision énergétique à court et à long terme, ainsi que dans les projets de recherche sur la charge. Quan a développé et mis en œuvre plusieurs systèmes de prévision automatisés pour prédire la demande système du lendemain, les profils de charge et la consommation au détail pour des entreprises aux États-Unis et au Canada. Les solutions de prévision à court terme comprennent des systèmes pour le « Midwest Independent System Operator » (MISO) et le « California Independent System Operator » (CAISO). Les solutions de prévision à long terme comprennent le développement et le soutien des prévisions à long terme (ventes et clients) pour des clients tels que « Dairyland Power » et « Omaha Public Power District ». Ces prévisions comprennent des informations sur l'utilisation finale et les impacts de la gestion de la demande dans un cadre économétrique. Enfin, Quan a participé à la mise en œuvre de systèmes de recherche de charge, notamment chez Snohomish PUD. Avant de rejoindre Itron, Quan a travaillé dans les secteurs du gaz, de l'électricité et de l'entreprise chez Pacific Gas and Electric Company (PG&E), où il a participé à la restructuration du secteur, à la planification de l'électricité et à la planification du gaz naturel. M. Quan est titulaire d'un master en recherche opérationnelle de l'université de Stanford et d'une licence en mathématiques appliquées de l'université de Californie à Los Angeles.