“Help” was the desperate cry of a MetrixLT user after the close of the workday.
“I need to multiply two hourly interval data series in MetrixLT!” While the user understood the action can be accomplished in MetrixND or Excel, he didn’t want to leave the MetrixLT environment. After all, who wants to export data to a separate environment, perform a simple calculation, then re-import data back to MetrixLT?
MetrixLT was designed to perform complex functions such as scaling interval data to monthly data. For instance, an hourly profile (interval data) can easily be scaled to a monthly energy forecast (monthly data) in the Batch Transformation object. But, MetrixLT was not designed to address this user’s urgent need.
With flashbacks to the Apollo 13 movie scene of NASA engineers fitting a square air filter into a round hole, we went to work searching for a way to make MetrixLT perform a task that was not originally intended.
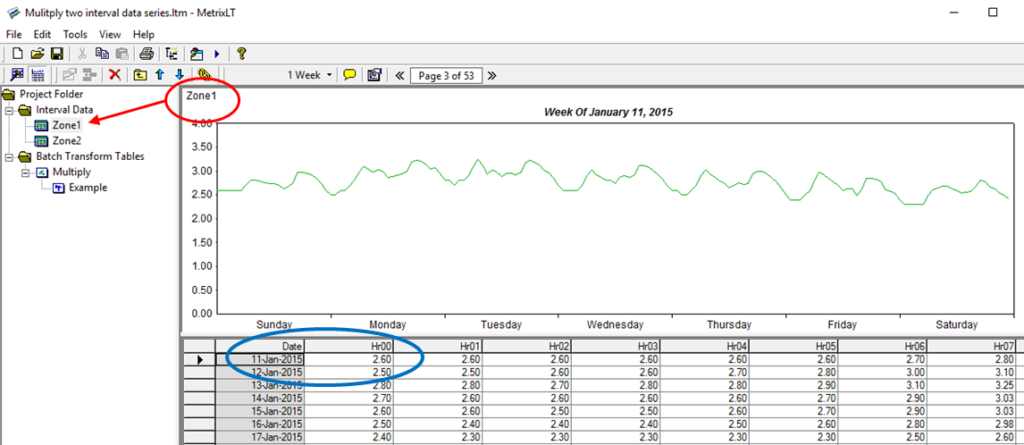
Step 1: Import Interval Data
Use the Import Interval Data feature to create two hourly Data Tables in MetrixLT. In the example below, data for Zone1 and Zone2 are imported into MetrixLT. I’ve highlighted the January 11, 2015 values to check our work.
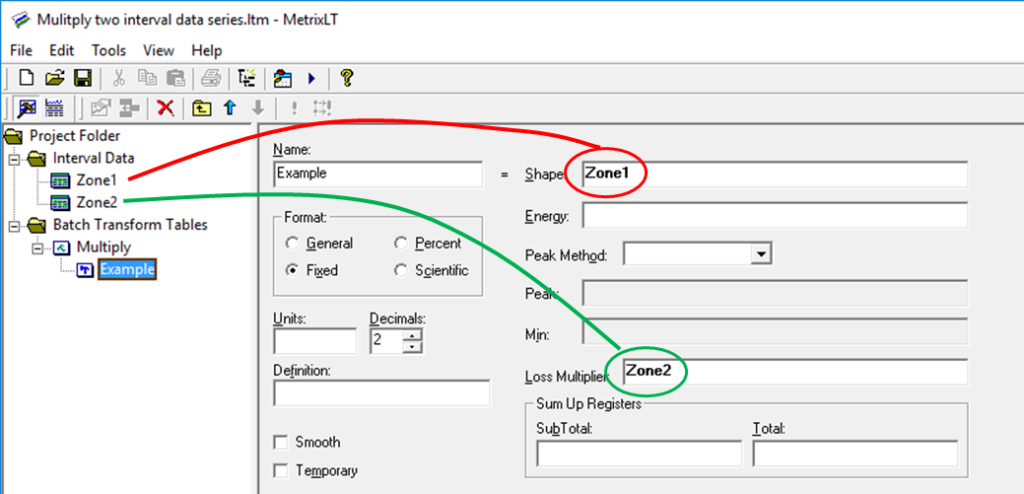
Step 2: Configure A Batch Transformation
Create a Batch Transformation and configure the Shape and Loss Multiplier boxes with the Zone1 and Zone2 interval data. In the example, Zone1 interval data is placed in the Shape box and Zone2 interval data is placed in the Loss Multiplier box.
By leaving the Energy field empty, the Batch Transformation will not perform scaling resulting in Shape field values multiplying with the Loss Multiplier field values.
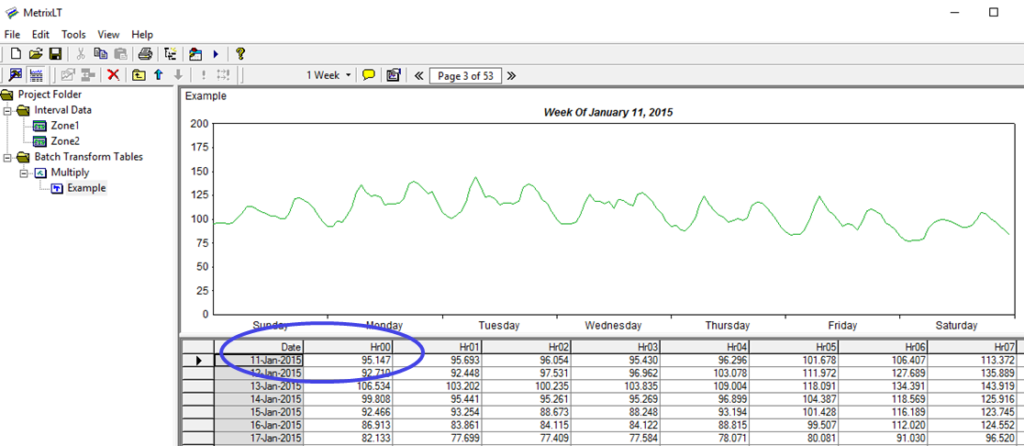
Step 3: Calculate the Result
Select the “!” to calculate the Batch Transformation result and you are finished.
I’ve highlighted the validation for January 11, 2015.
Zone 1 = 2.60
Zone 2 = 36.595
Product = (Zone 1) x (Zone 2) = 95.147
Zone 1 values are now multiplied by Zone 2 values and stored in a Batch Transformation variable.
And that is how we fit a square air filter into a round hole.
Mark Quan is a Principal Forecast Consultant with Itron’s Forecasting Division. Since joining Itron in 1997, Quan has specialized in both short-term and long-term energy forecasting solutions as well as load research projects. Quan has developed and implemented several automated forecasting systems to predict next day system demand, load profiles, and retail consumption for companies throughout the United States and Canada. Short-term forecasting solutions include systems for the Midwest Independent System Operator (MISO) and the California Independent System Operator (CAISO). Long-term forecasting solutions include developing and supporting the long-term forecasts of sales and customers for clients such as Dairyland Power and Omaha Public Power District. These forecasts include end-use information and demand-side management impacts in an econometric framework. Finally, Quan has been involved in implementing Load Research systems such as at Snohomish PUD. Prior to joining Itron, Quan worked in the gas, electric, and corporate functions at Pacific Gas and Electric Company (PG&E), where he was involved in industry restructuring, electric planning, and natural gas planning. Quan received an M.S. in Operations Research from Stanford University and a B.S. in Applied Mathematics from the University of California at Los Angeles.