For most things in life, I look forward to go forward. I keep my eyes on the road ahead. I look before I leap. I aim at my target. But this summer while we were on our family vacation, we rented a row boat and it reminded me that rowing a boat is different. When rowing, I face backward to maximize my power going forward. Forecasting electricity is like rowing a boat, we need to look backward to go forward.
Intuitively, we already do this by using regression models. Regression models look backward, find relationships and project them forward. Although too often, we leave the looking to models instead of our own eyes.
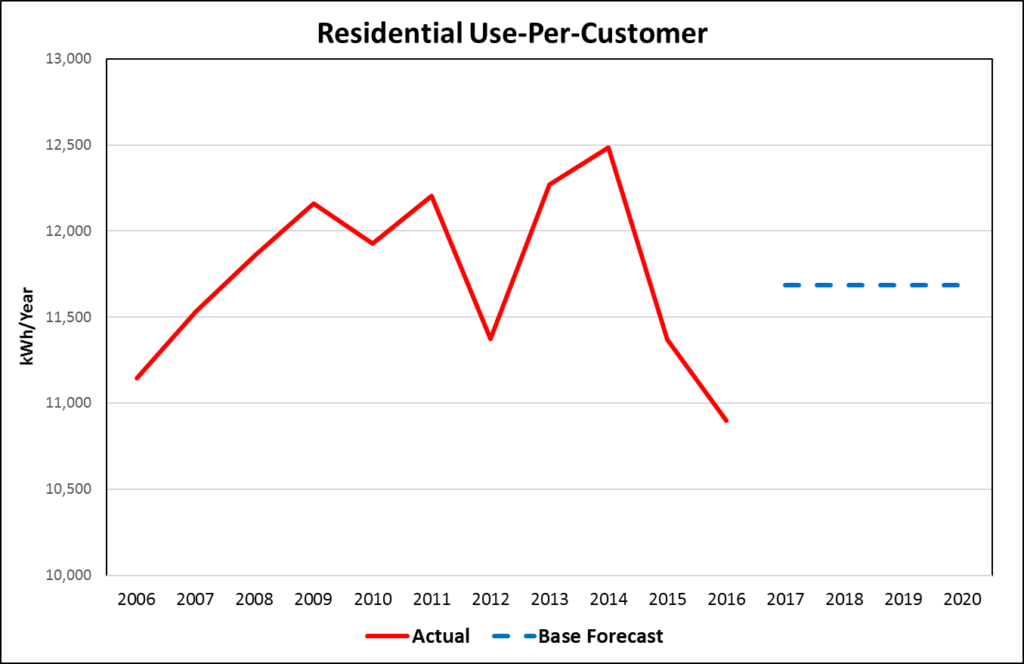
Below is annual historical average use for residential customers over an 11-year period. Leaving the forecast to a regression model with HDD, CDD, and some binary variables, the outlook is close to 11,600 kWh/year (blue dashed line) and flat because the model does not include any trend variables.
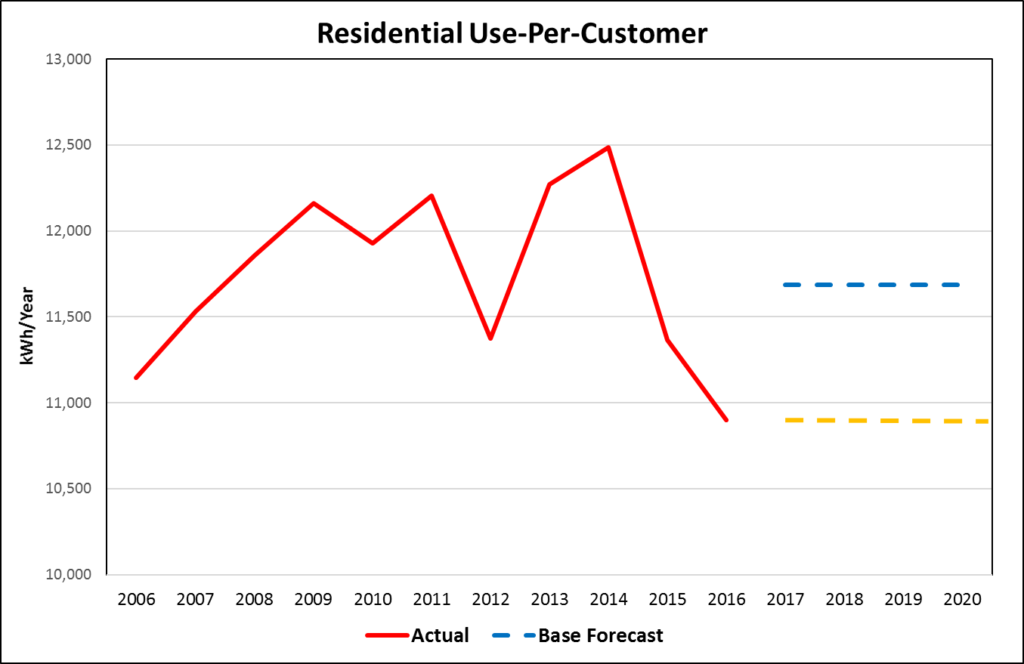
But, the last three years show dramatic decline in usage and raises the question of whether the forecast should be closer to 11,000 kWh/year (yellow-dashed line).
Instead of leaving the forecast to the model, we should use our own eyes to identify the underlying pattern in the history. Is average use declining?
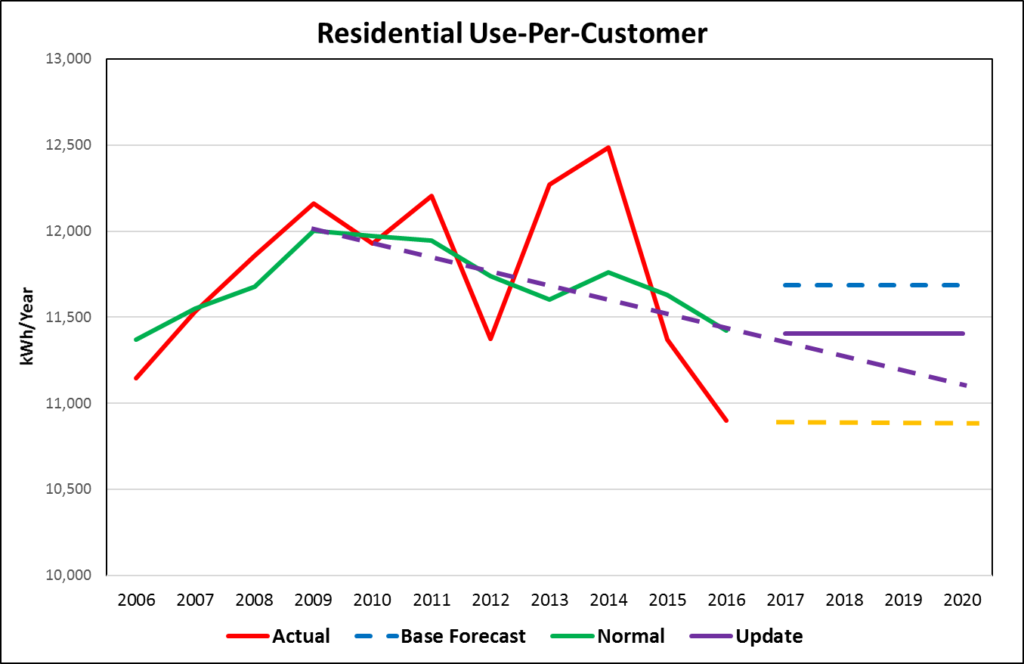
The only way to answer this question is to weather normalize historic average use removing the impact of weather variation. Weather normalization will answer the question of why 2016 was so low, why 2014 was so high, and what happened in 2012.
After weather normalizing historic average use, we can answer what happened in 2012, 2014, and 2016.
2012 was a mild weather year
2014 was an extreme weather year
2016 was a mild weather year
Additionally, we can see that average usage has consistently declined from 2009 to 2016.
If we assume the trend stops in 2016, the forecast should be close to 11,400 kWh (purple solid line). If we assume the trend continues, the forecast will be close to 11,000 kWh/year in 2020 (purple dashed line).
Weather normalization is an essential part of the forecaster’s work process. The process allows us to look backwards to ensure that we move forward in the right direction.
Mark Quan is a Principal Forecast Consultant with Itron’s Forecasting Division. Since joining Itron in 1997, Quan has specialized in both short-term and long-term energy forecasting solutions as well as load research projects. Quan has developed and implemented several automated forecasting systems to predict next day system demand, load profiles, and retail consumption for companies throughout the United States and Canada. Short-term forecasting solutions include systems for the Midwest Independent System Operator (MISO) and the California Independent System Operator (CAISO). Long-term forecasting solutions include developing and supporting the long-term forecasts of sales and customers for clients such as Dairyland Power and Omaha Public Power District. These forecasts include end-use information and demand-side management impacts in an econometric framework. Finally, Quan has been involved in implementing Load Research systems such as at Snohomish PUD. Prior to joining Itron, Quan worked in the gas, electric, and corporate functions at Pacific Gas and Electric Company (PG&E), where he was involved in industry restructuring, electric planning, and natural gas planning. Quan received an M.S. in Operations Research from Stanford University and a B.S. in Applied Mathematics from the University of California at Los Angeles.