Behind-The-Meter Solar Generation and Real-Time Load Forecasting
March 20, 2017
Share this story on:
Recently, I was invited to speak at a California Energy Commission (CEC) sponsored workshop on Research Needs for Renewable Energy Forecasting. The goal of the workshop was to discuss forecasting tools and methods and how those are being used today; research and development needs; and solutions to address anticipated operational needs of utilities and balancing authorities. While the core topic was improving solar and wind generation forecasting, a slot was made available to me given our work with the California ISO on how to incorporate the impact of behind-the-meter solar generation on real-time load forecasting. Here is the list of load forecasting challenges I presented.
Challenge 1. Growing Disconnect between Measured Load and Demand for Electricity Services. The vast majority of operational load forecasts are based on some form of a statistical model using neural network or regression techniques. If there are no unmeasured sources of generation between how people and businesses use electricity and how it is measured (i.e. metered) then measured load equals the demand for electricity services. In this case, the modeling challenge is to develop explanatory variables that describe the demand for electricity services. With the deep penetration of behind-the-meter (BTM) solar generation, battery storage, and other distributed energy resources, what is measured as load is no longer a perfect measure of the demand for electricity services. That is, measured load is the net of demand for electricity services less behind-the-meter resources.
Why does this matter? If the BTM source of electricity services was stable and predictable, then the load forecast models, once they have been re-estimated using the new lower measured demand, will provide strong forecasts of measured demand. Conversely, if the BTM source of electricity services is not stable and not easy to predict, then the load forecast models will provide weak forecasts of measured demand. Unfortunately, BTM resources like solar generation and battery storage fall into the unstable and hard to predict category. In places where there has been significant penetrations of BTM solar generation, we have seen day-ahead load forecast MAPEs erode. As a result, we have been working closely with our ISO and utility clients on incorporating forecasts of BTM solar generation into load forecast models. The study we completed for the CEC Improving Short-term Load Forecasts by Incorporating Solar PV Generation, CEC EPC-14-001 (draft, February, 2017) provides a template for how to improve short-term load forecast models by incorporating forecasts of BTM solar generation.
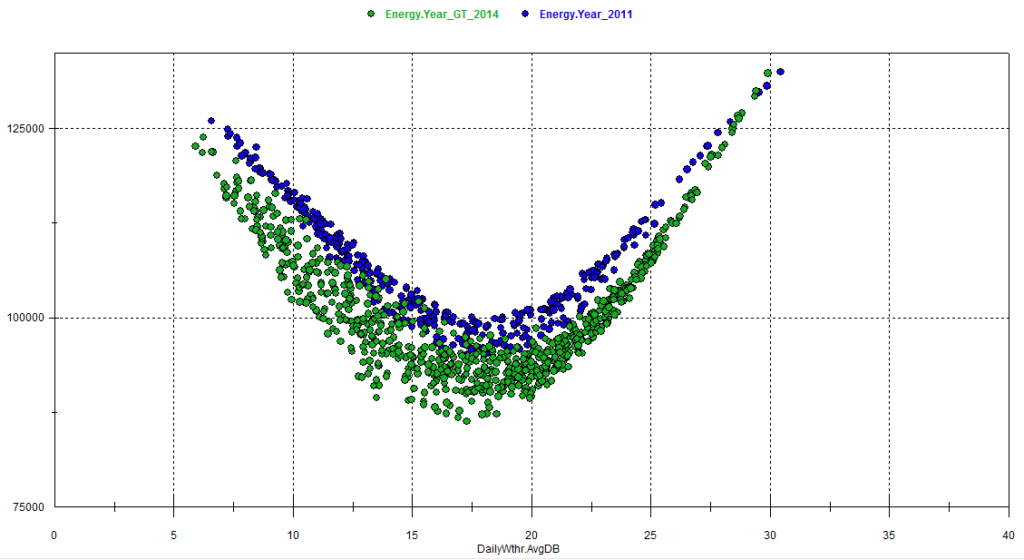
Challenge 2. The Relationship between Measured Load and Weather is Becoming Cloudy. One consequence of the deep penetration of BTM solar generation is that the relationship between measured load and temperature becomes less certain. This is illustrated in the figure below. Here, the blue dots represent the statistically estimated weather response function between average daily loads and average daily temperatures. This weather response function was estimated using data for 2011. The nonlinear response is consistent with the presence of both electric space heating (the data points to the left of approximately 18 degrees Celsius) and air conditioning (the data points to the right of 18 degrees Celsius). The green dots are the estimated weather response function for the years 2015 and 2016. The 2015/2016 estimated weather response function differs from the estimated 2011 response function is four key ways.
Average Load Reduction. On average, the loads in 2015/2016 are lower than the 2011 loads. This could be as a result of a general reduction in economic conditions and/or a deep penetration of BTM. For these data, the BTM solar generation tripled between 2011 and 2016. As a result, it is reasonable to state that a good proportion of the reduction in average load is attributed to the presence of BTM solar generation.
Increased Weather Sensitivity. The estimated weather response on the air conditioning side is much steeper in 2015/2016 than 2011. This gives the appearance that measured load has become more weather sensitive over time. For example, the estimated increase in load when temperatures went from 20 to 25 degrees in 2011 is approximately 2,400 MWh increase per degree. The same lift in temperatures in 2015/2016 leads to an increase of about 3,000 MWh per degree.
Increased Load Volatility. The relationship between loads and average temperatures has gotten more volatile in 2015/2016. This can be seen by taking a vertical slice through the scatter plot at 20 degrees Celsius. The approximate width of the estimated response function in 2011 was about 4,600 MWh. The same slice through the 2015/2016 estimated weather response function leads to a range of 7,400 MWh. As a result, even with a perfect temperature forecast, it can be expected that the load forecast errors will be higher in 2015/2016 than 2011 unless other factors that account for the increased load volatility are added to the forecast model.
Air Conditioning Gains Out Weigh BTM Solar Generation Reductions at Extreme Temperatures. One last observation can be made by focusing on the estimated weather response functions at extremely hot temperatures (i.e. temperatures above 25 degrees Celsius or 77 degrees Fahrenheit). At extremely hot temperatures, the estimated weather response function from 2015/2016 approaches and then crosses over the 2011 estimated weather response. This is of interest because it is known that BTM solar generation in 2015/2016 was at least triple of the amount available in 2011. Yet, the estimated amount of air conditioning is higher in 2015/2016. This suggests that the increased penetration of BTM solar generation has gone hand-in-hand with an increased penetration of air conditioning loads. Some of the air conditioning increase more than likely came from additional installed equipment. But, this also raises the possibility that when BTM solar generation is installed, customers that had air conditioning before the installation of solar are now running their air conditioners more frequently than before. For example, I might be more apt to let my air conditioner run all day after having solar installed as a way of using the now “free” electricity. The potential for behavioral changes being driven by the adoption of BTM solar can wreak havoc on short-term loads forecasts.
Figure. Estimated Weather Response Functions 2011 versus 2015/2016.
Challenge 3. Increased Load Forecast Errors and Error Volatility. The collective impact of Challenge 1 and 2 is an increase in the average load forecast error (e.g. an increase in day-ahead load forecast MAPEs) and an increase in the load forecast error variance. Traditional load forecast models that do not include some treatment of the impact of BTM solar generation will become increasingly less reliable. Further, load forecast confidence bounds that do not account for load volatility associated with BTM solar generation volatility will under represent the true load forecast uncertainty. This erosion in forecast performance will only get worse as the market adopts BTM storage, time-of-use rates, electric vehicle charging and demand response activity, all of which either drive changes in the demand for electricity services or how those services are met. Unfortunately, today’s metering leaves system operators blind to how these technologies and market prices will change behavior. This in turn challenges load forecasters on how they should enhance their load forecast models and processes.
Challenge 4. Constructing Load Forecast Confidence Bounds. The erosion of load forecast performance has led to a call for confidence bounds around the load forecast. Traditionally, confidence bounds were based on the load forecast model standard error. More sophisticated approaches included weather forecast error in the calculation, thus both the model and weather forecast errors drove the uncertainty bands. Other traditional approaches drove predefined extreme weather scenario data through the load forecast models to construct Probability of Exceedance load forecasts. With deep penetration of BTM solar generation and the potential in the future for deep penetration of other technologies and market price driven changes the old ways are not sufficient. What is needed is a means of forecasting load uncertainty over multiple dimensions that are consistent across the dimensions. For example, where in the past it was sufficient to capture temperature forecast uncertainty, it is now important to capture both temperature and cloud cover (or solar irradiance) uncertainty in a realistic way. For example, extremely hot days are normally accompanied by low cloud days. Conversely, high solar irradiance days are not always associated with hot temperatures. This makes it difficult to define extreme weather events. This is further complicated if the service territory spans a large and diverse weather region. In these cases, the challenge is how to construct confidence bounds that preserve realistic weather pattern uncertainty.
From a load forecasting perspective, these challenges are leading to an evolution in the way we develop models and forecasts. In my next blog, I will discuss the steps Itron is taking to lead this evolution.
Dr. Frank A. Monforte is Director of Forecasting Solutions at Itron, where he is an internationally recognized authority in the areas of real-time load and generation forecasting, retail portfolio forecasting, and long-term energy forecasting. Dr. Monforte’s real-time forecasting expertise includes authoring the load forecasting models used to support real-time system operations for the North American system operators, the California ISO, the New York ISO, the Midwest ISO, ERCOT, the IESO, and the Australian system operators AEMO and Western Power. Recent efforts include authoring embedded solar, solar plant, and wind farm generation forecast models used to support real-time operations at the California ISO. Dr. Monforte founded the annual ISO/TSO Forecasting Summit that brings together ISO/TSO forecasters from around the world to discuss forecasting challenges unique to their organizations. He directs the implementation of Itron’s Retail Forecasting System, including efforts for energy retailers operating in the United Kingdom, Netherlands, France, Belgium, Italy, Australia, and the U.S. These systems produce energy forecasts for retail portfolios of interval metered and non-interval metered customers. The forecast models he has developed support forecasting of power, gas and heat demand and forecasting of wind, solar, landfill gas, and mine gas generation. Dr. Monforte presides over the annual Itron European Energy Forecasting Group meeting that brings together European Energy Forecasters for an open exchange of ideas and solutions. Dr. Monforte directed the development of Itron’s Statistically Adjusted End-Use Forecasting model and supporting data. He founded the Energy Forecasting Group, which directs primary research in the area of long-run end-use forecasting. Recent efforts include designing economic indices that provide long-run forecast stability during periods of economic uncertainty. Email Frank at frank.monforte@itron.com, or click here to connect on LinkedIn.